SaaS · Infrastructure monitoring

Pingura

Our own product — a monitoring platform that watches websites, APIs, cron jobs, SSL certificates, domains, and private infrastructure, and alerts before customers notice. Private probes let it reach services inside a firewall. We built the platform, we run it, we sell it, and we use it to watch the sites we host. It monitors itself, too.

What we did

  • A check engine in Go, and the application in PHP and Laravel
  • Public probes in five regions — Northern Virginia, Los Angeles, London, Frankfurt, and Singapore
  • Private probes, so monitors can reach services that are not exposed to the internet
  • Monitor types past HTTP: MySQL, Redis, cron-job heartbeats, SSL certificate expiry, and domain expiry
  • Response time split into DNS, connect, TLS, server, and transfer, so a slowdown points at something rather than just being slow
  • Server metrics that stay correct across auto-scaling
  • Alerting over email, SMS, Slack, Teams, and webhooks
  • Multi-tenant accounts with team members and per-plan limits
  • Subscription billing — a free tier, monthly and annual terms
  • Public and custom status pages, with subscriber notifications
  • Incident management and maintenance windows
  • The marketing site, the docs, and the comparison pages

Result

Runs around 750,000 checks a day, from probes in five regions.
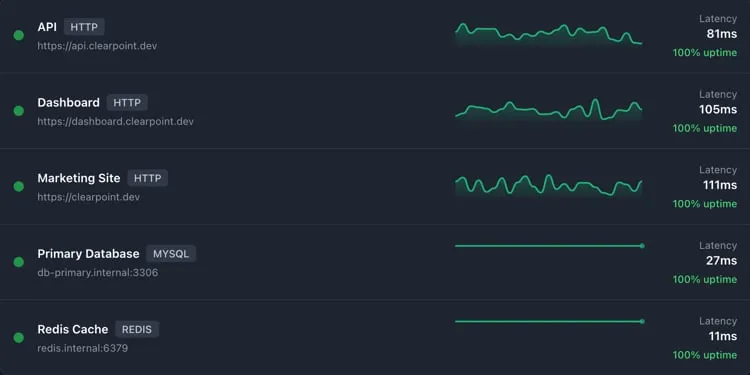
A Pingura monitor list: five rows, each with a green status dot, name and protocol tag, a latency sparkline, and an uptime figure. HTTP monitors for an API, dashboard and marketing site sit alongside MySQL and Redis monitors pointing at internal hostnames.
The monitor list. The MySQL and Redis rows point at internal hostnames — those are reached through a private probe rather than from the public internet, which is the hard part of the product.
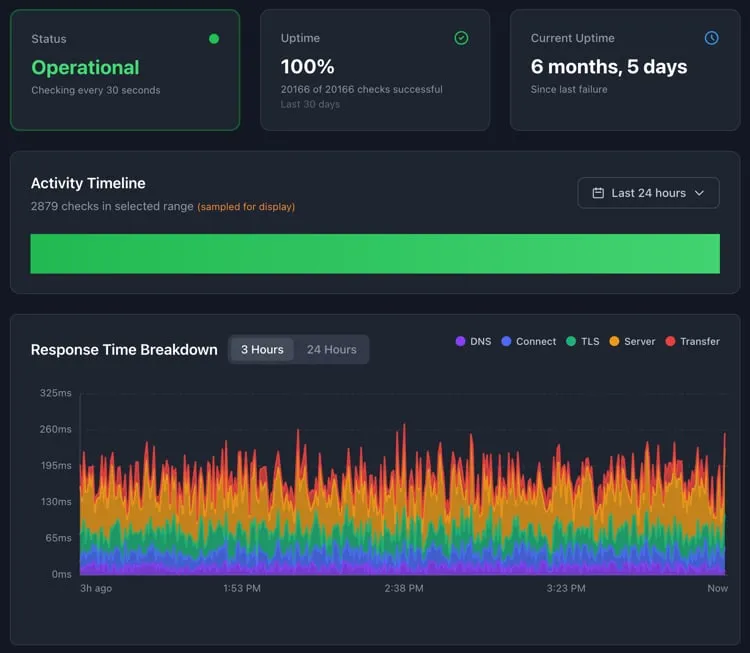
A Pingura monitor detail view: status tiles reading Operational, an uptime percentage and a current-uptime duration, an activity timeline, and a stacked area chart of response time broken into DNS, Connect, TLS, Server and Transfer phases with a three-hour and 24-hour toggle.
A single monitor. Response time is broken into DNS, connect, TLS, server, and transfer — the difference between knowing a site got slower and knowing which layer to go look at.
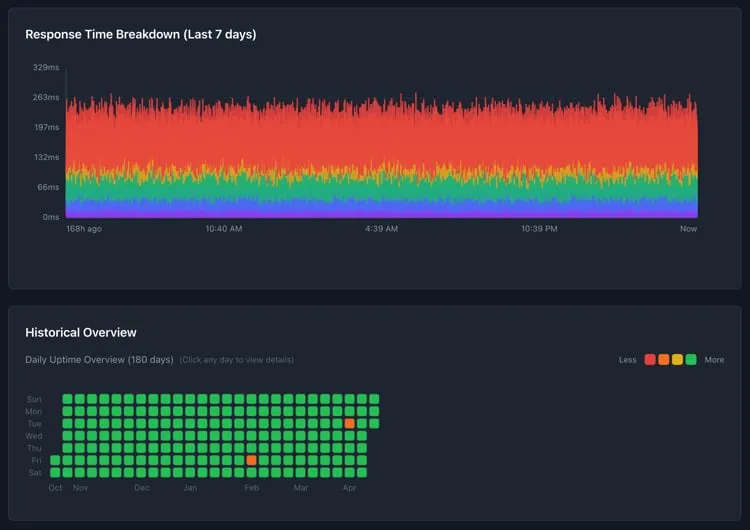
Two Pingura charts: a seven-day stacked area chart of response time by phase, and a Historical Overview showing 180 days of daily uptime as a grid of colored squares, mostly green with two red days.
Six months of daily uptime as a grid. A bad day is obvious at a glance, where a line chart of the same span would bury it.
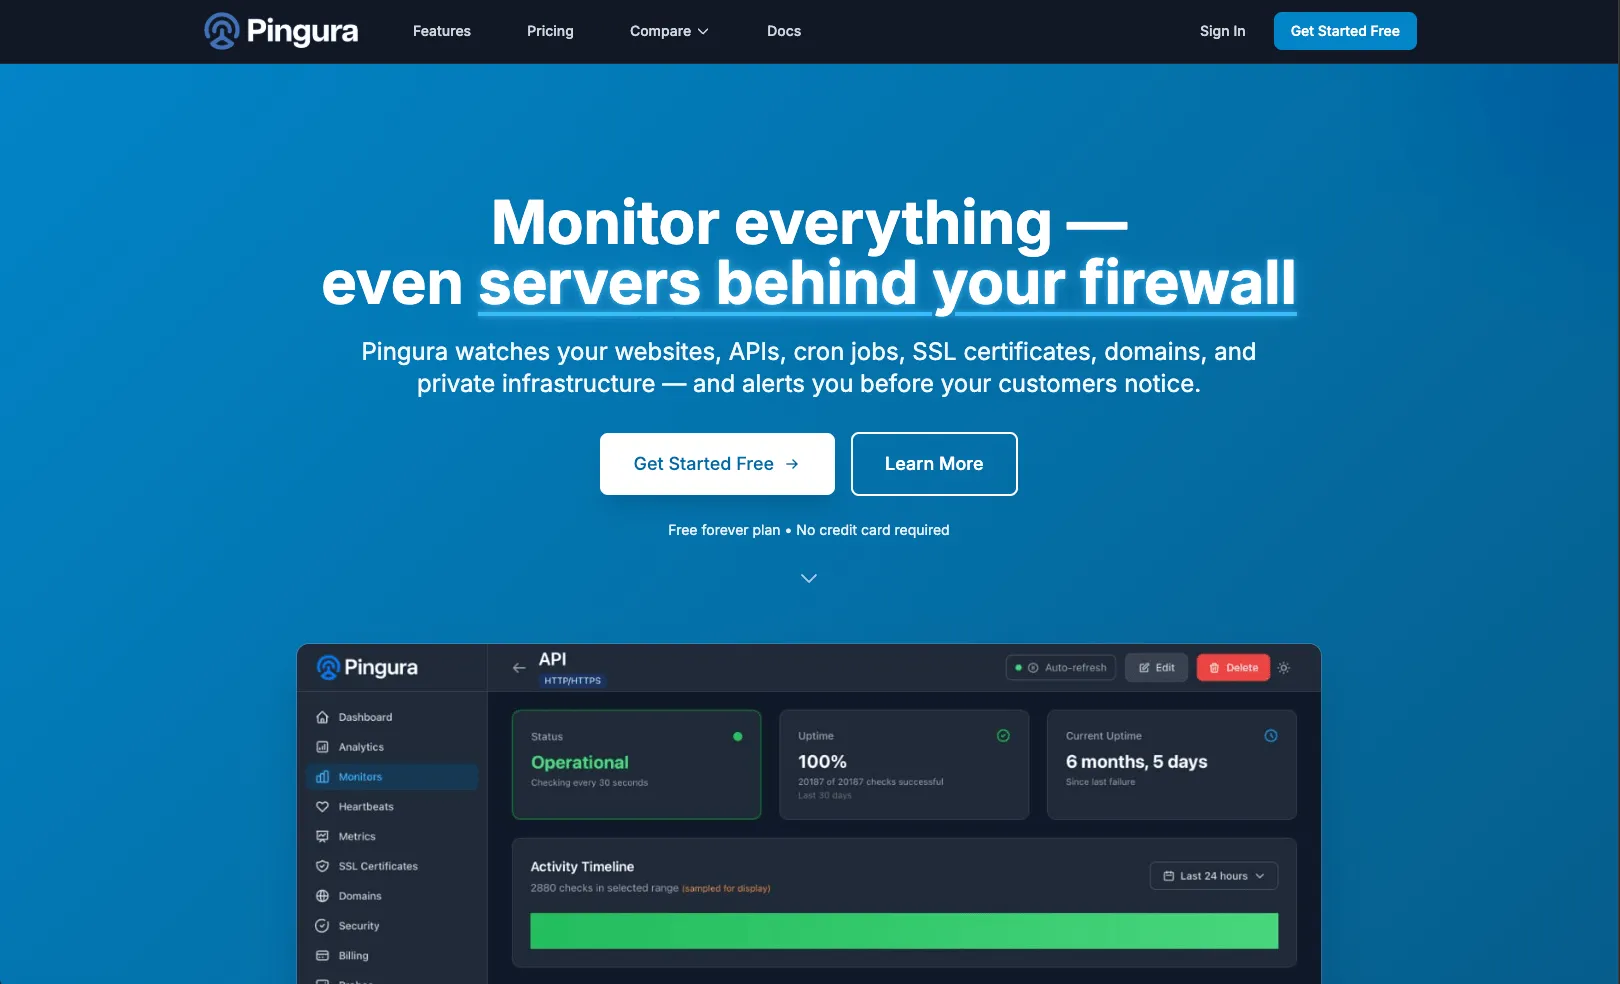
The Pingura home page: a blue gradient hero reading “Monitor everything — even servers behind your firewall”, with Get Started Free and Learn More buttons and a screenshot of the monitoring dashboard below.
The marketing site leads on the firewall claim, because that is the thing most competitors cannot do.
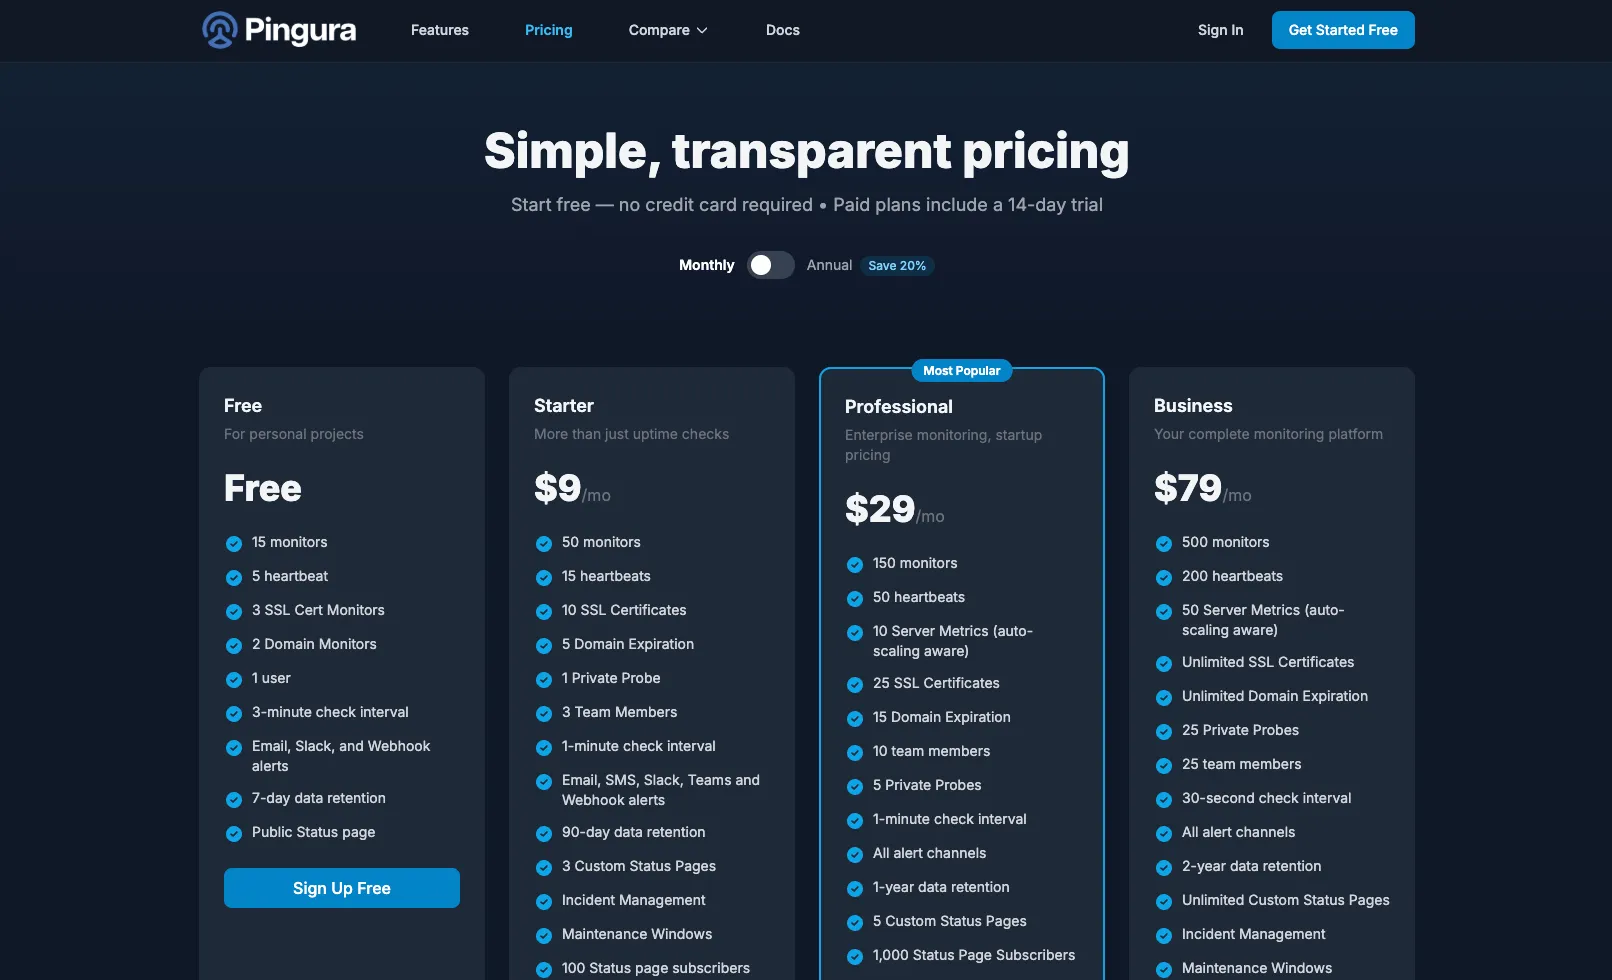
The Pingura pricing page: a monthly and annual toggle above four plans — a free tier, Starter at $9 a month, Professional at $29 marked most popular, and Business at $79 — each listing monitor, heartbeat, probe and retention limits.
Four tiers with a free plan. Every limit on this page is a quota the application has to enforce, which is most of what separates a monitoring tool from a monitoring business.

Start here

Tell us what you need built.

You’ll get a real reply from the person who would do the work — not a sales rep and not an automated sequence.